Performance Data
Performance Data

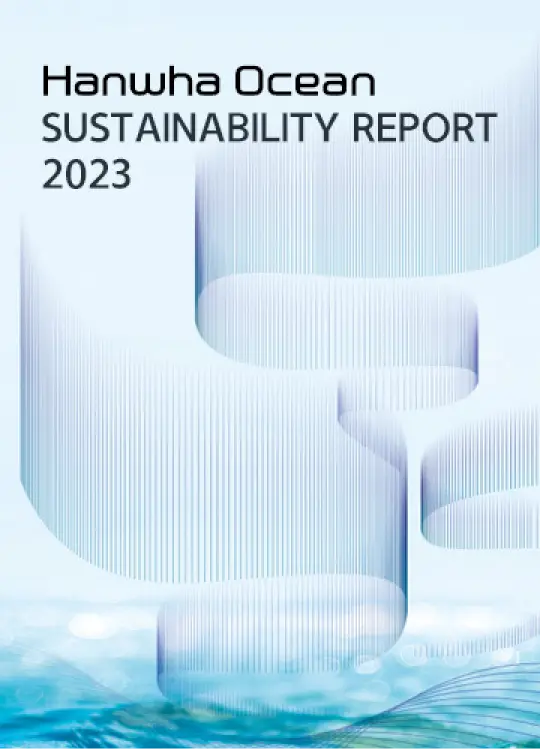
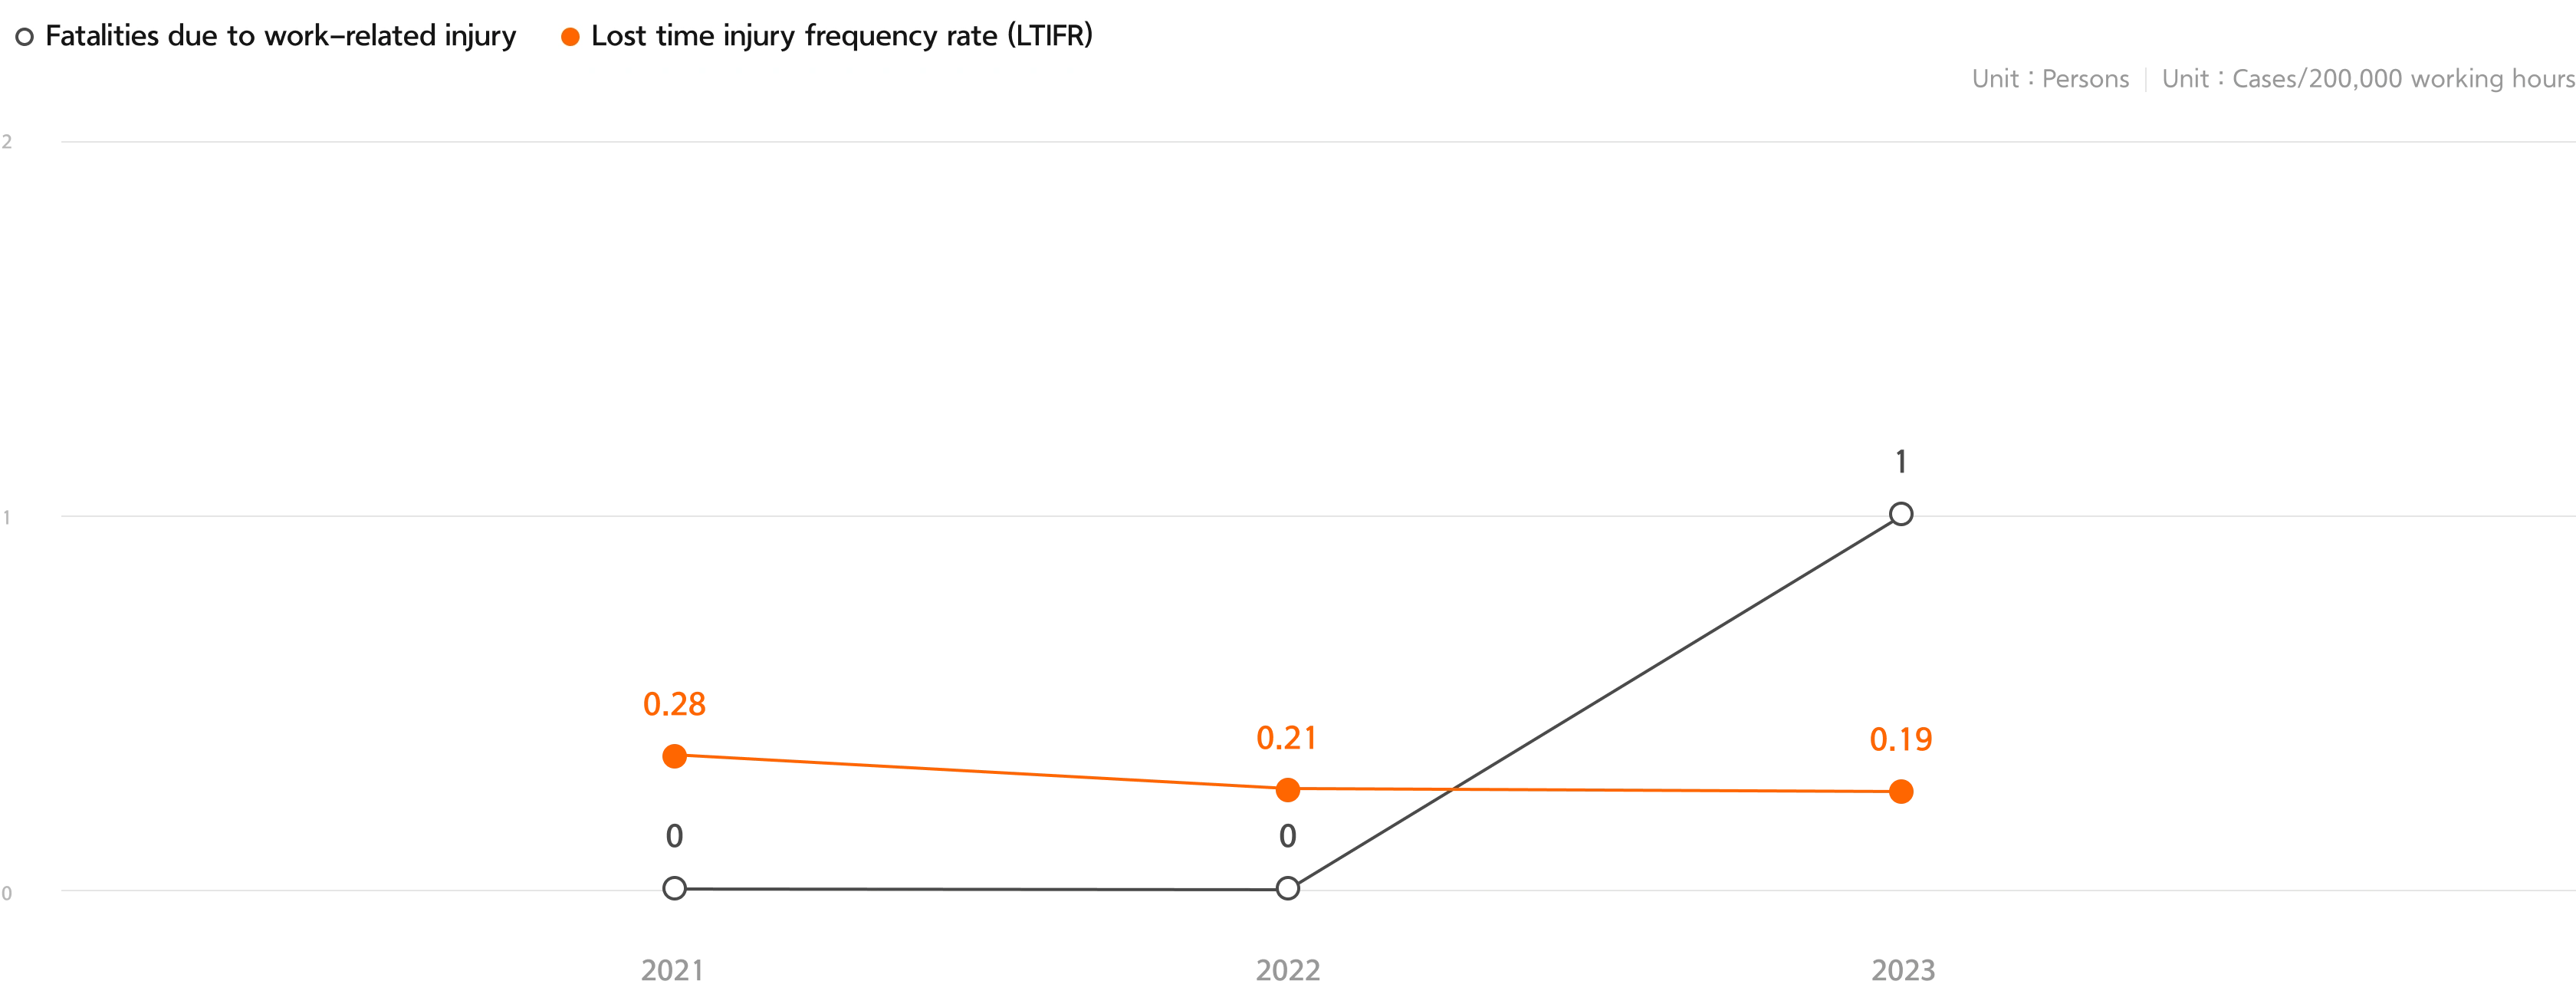
Safety and Health
Safety Management
Safety and Health Training
| Indicator | Unit | 2021 | 2022 | 2023 | |
|---|---|---|---|---|---|
| Employees | Participants | Persons | 8,684 | 8,375 | 8,833 |
| Training hours | Hours | 202,810 | 169,858 | 179,892 | |
| Training hours per employee |
Hours | 23 | 20 | 22 | |
| Participation rate | % | 100 | 100 | 99 | |
| Suppliers | Participants | Persons | 10,424 | 12,056 | 15,574 |
| Training hours | Hours | 290,166 | 355,214 | 515,292 | |
Talent Management
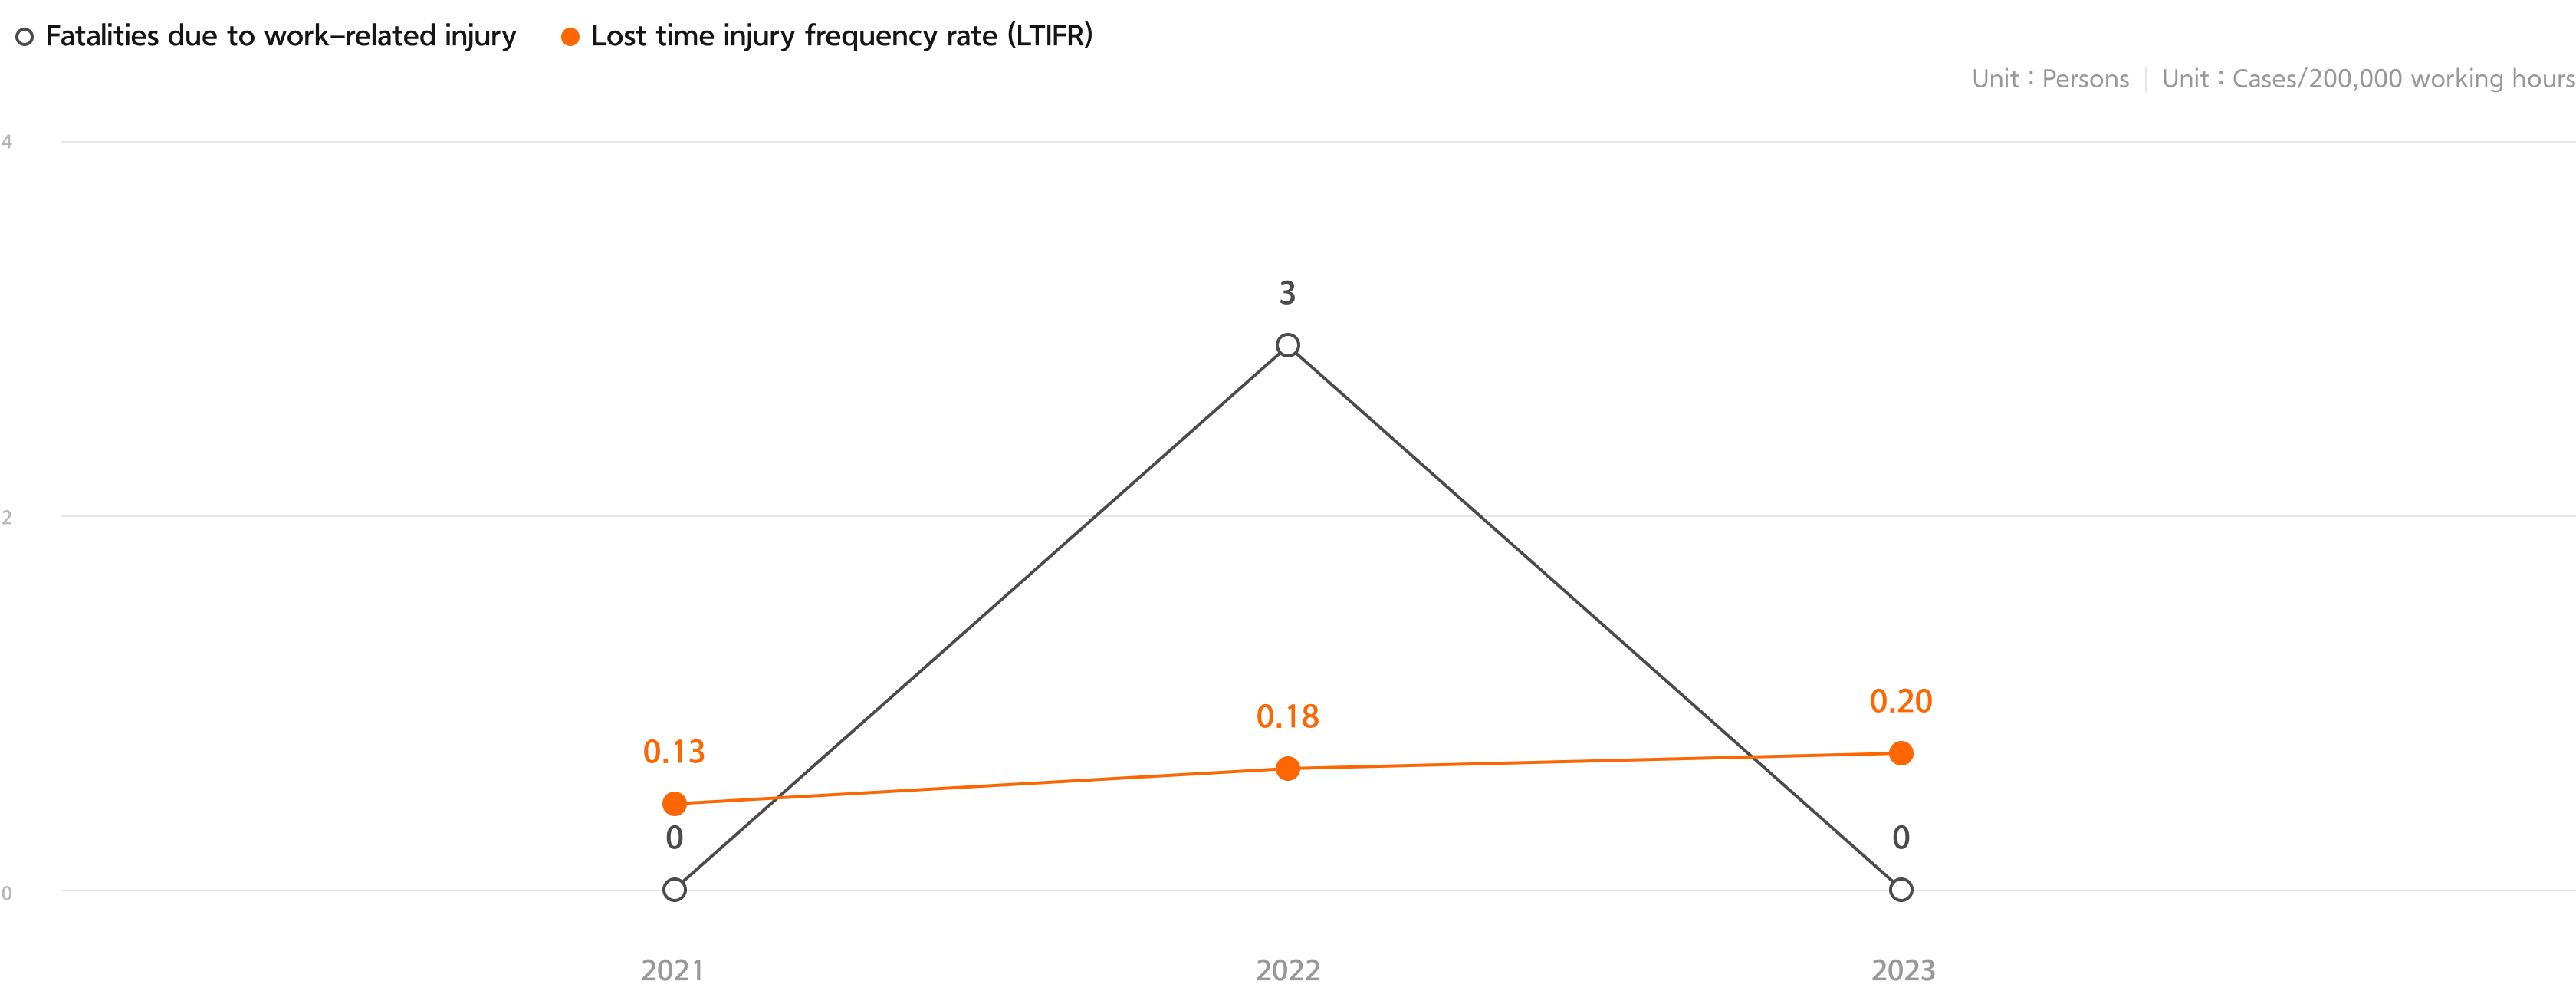
Employee Status
| Indicator | Unit | 2021 | 2022 | 2023 | |
|---|---|---|---|---|---|
| Total | No. of employees | Persons | 8,808¹⁾ | 8,635¹⁾ | 8,900²⁾ |
| By age | Below 30 | Persons | 539¹⁾ | 605¹⁾ | 598 |
| 30-49 | Persons | 5,599¹⁾ | 5,203¹⁾ | 5,265 | |
| 50 or older | Persons | 2,670¹⁾ | 2,827¹⁾ | 3,037 | |
| By employment type | Regular employees | Persons | 8,662¹⁾ | 8,315¹⁾ | 8,423 |
| Male | Persons | 8,364 | 8,008 | 8,107 | |
| Female | Persons | 298 | 307 | 316 | |
| Non-regular employees | Persons | 146¹⁾ | 320¹⁾ | 477 | |
| Male | Persons | 70 | 226 | 381 | |
| Female | Persons | 76 | 94 | 96 | |
- 1 ) Data modified due to changes in calculation criteria.
- 2 ) Including 8,892 people, 3 inside directors, and 5 outside directors based on the 2023 business report.
| Indicator | Unit | 2021 | 2022 | 2023 | |
|---|---|---|---|---|---|
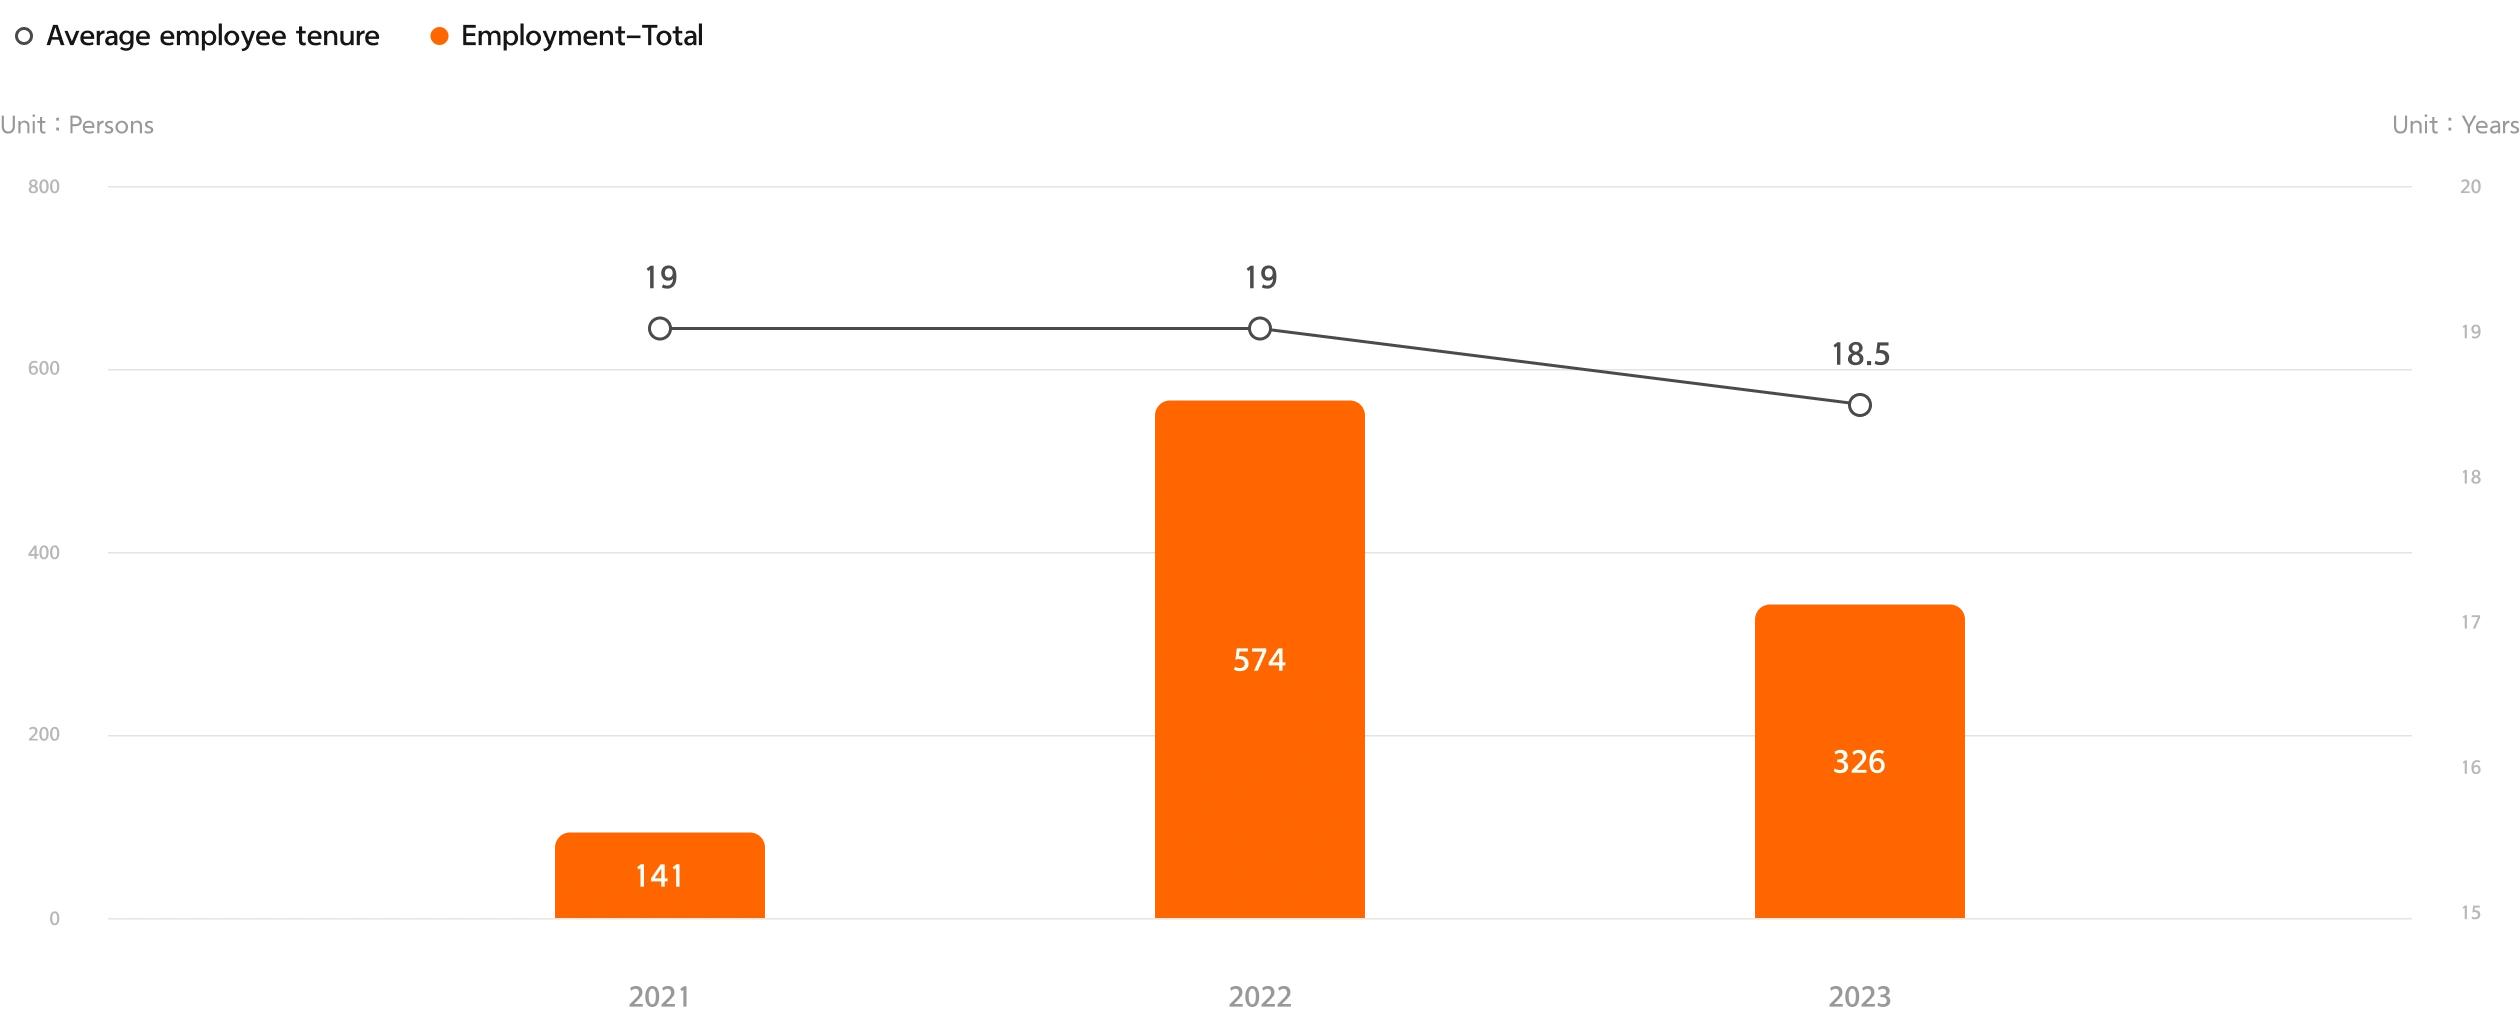
| Employment | Total | Persons | 141 | 574 | 326 |
| Employee turnover | Total number of employee turnover | Persons | 392 | 663 | 371 |
| Voluntary turnover | Persons | 109 | 469 | 172 | |
| Retention | Average employee tenure | Years | 19 | 19 | 18.5 |
| Indicator | Unit | 2021 | 2022 | 2023 |
|---|---|---|---|---|
| Training hours per employee | Hours | 45 | 87.02 | 28.00 |
| Training cost per employee | KRW 1,000 | 246 | 323 | 319 |
| Satisfaction | Points | 4.41 | 4.49 | 4.65 |
Supply Chain Management
and Shared Growth
Supply Chain Management
Supplier Management
| Indicator | Unit | 2021 | 2022 | 2023 | |
|---|---|---|---|---|---|
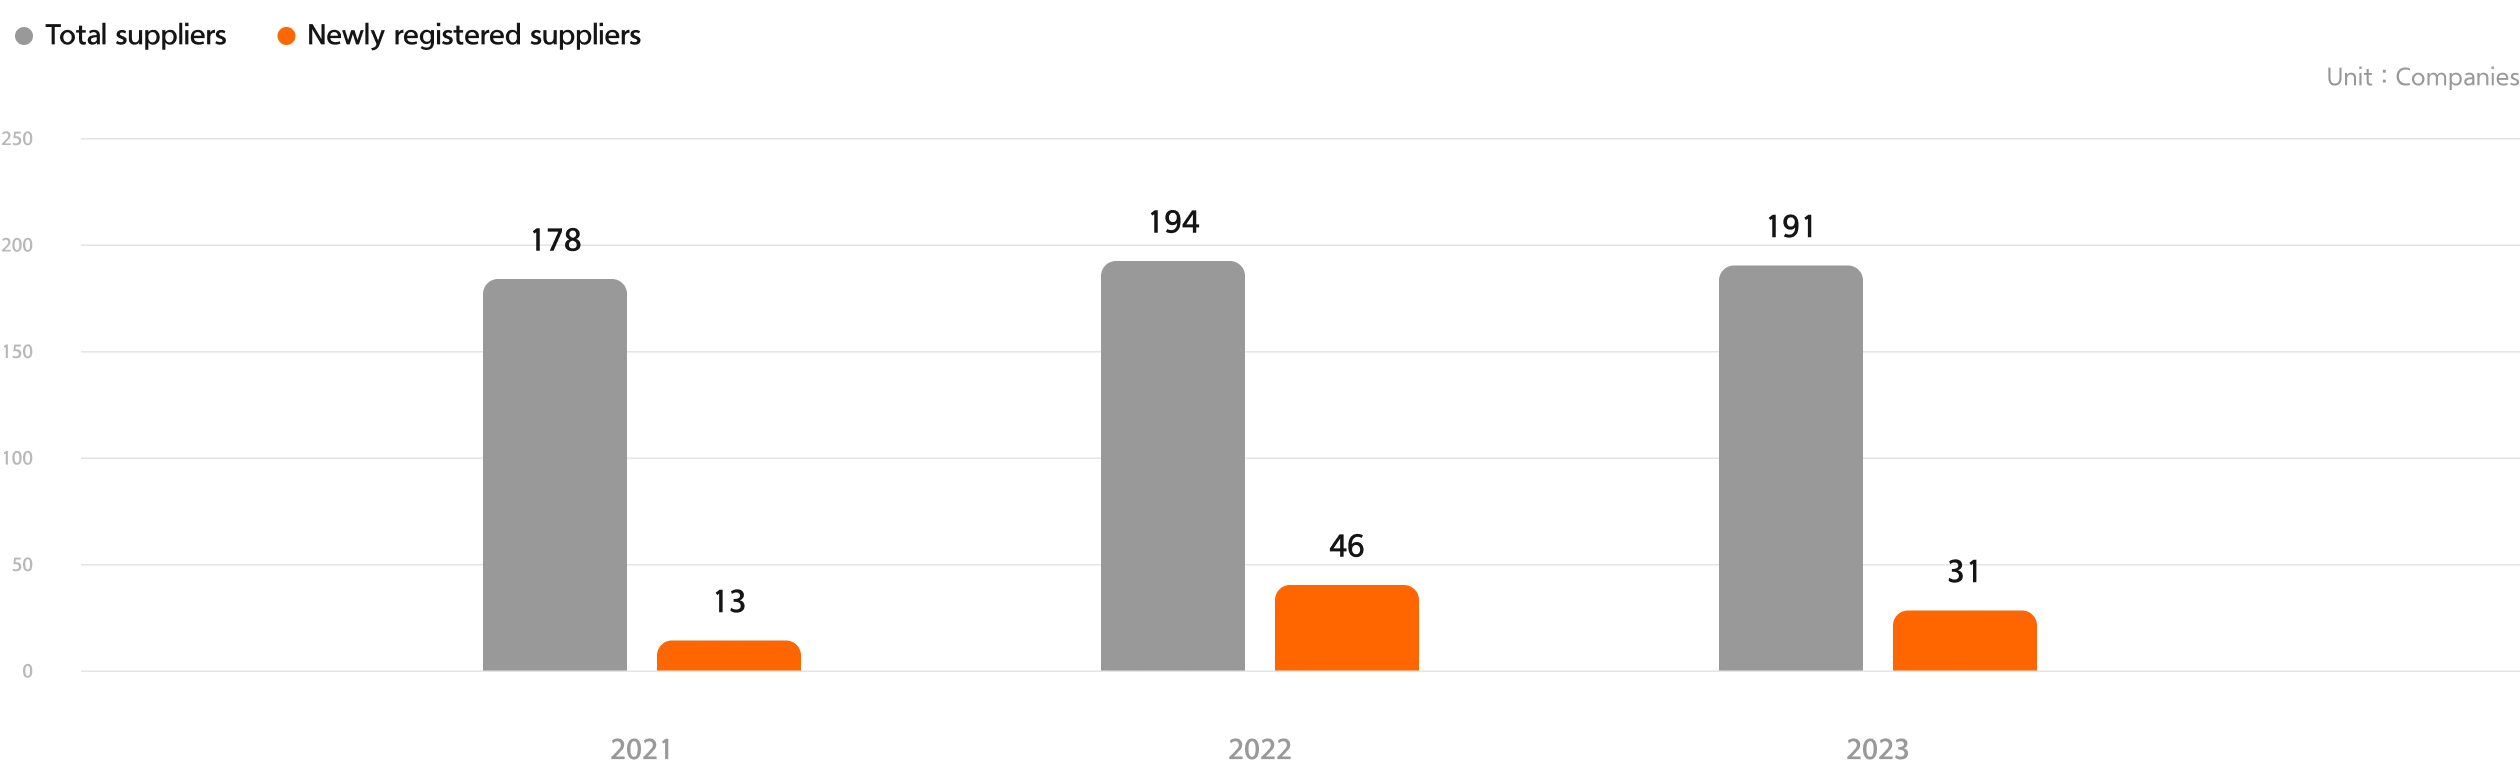
| Total suppliers | Total suppliers | Companies | 178 | 194 | 191 |
| Internal suppliers | Companies | 108 | 118 | 127 | |
| External suppliers | Companies | 70 | 76 | 64 | |
| Newly registered suppliers |
Newly registered suppliers | Companies | 13 | 46 | 31 |
| Internal suppliers | Companies | 6 | 19 | 10 | |
| External suppliers | Companies | 7 | 27 | 21 | |
Supplier ESG Support
| Indicator | Unit | 2021 | 2022 | 2023 | |
|---|---|---|---|---|---|
| Support amount |
Financing and funding | KRW 100 million |
60 | 10 | 20 |
Coexistence with Local Communities
Social Contribution
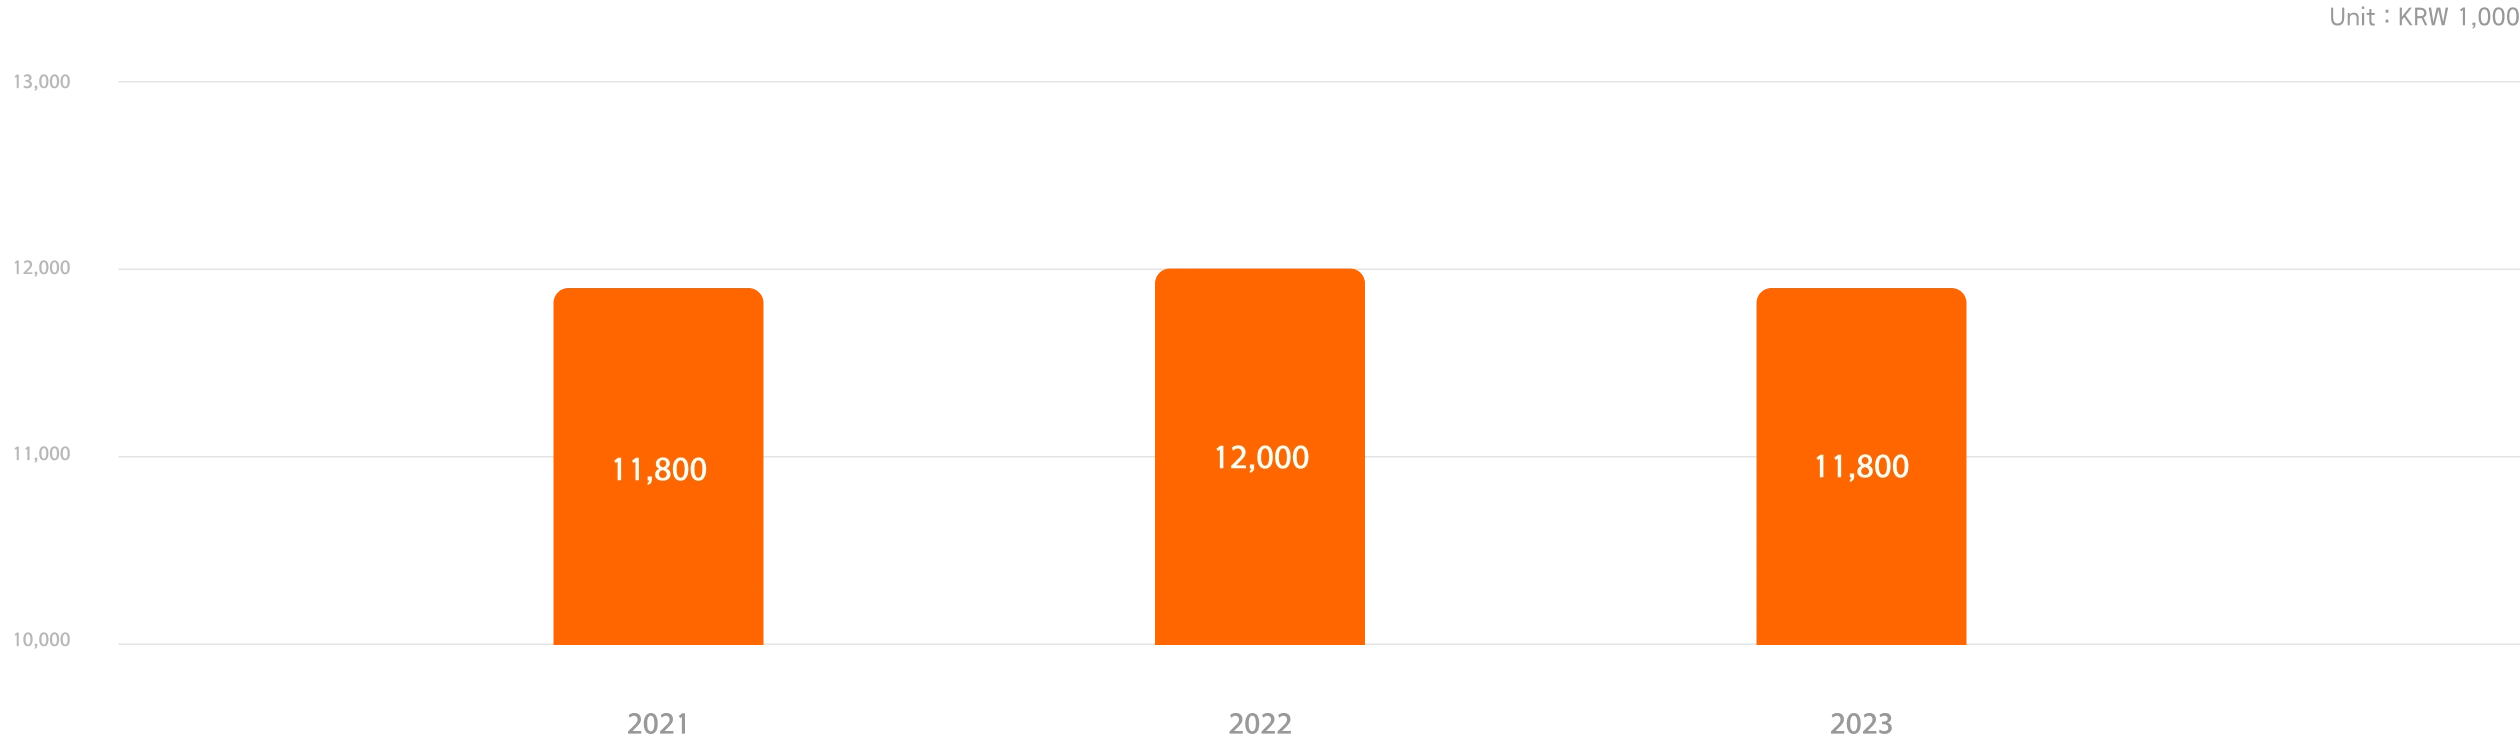
Scholarship Total
| Indicator | Unit | 2021 | 2022 | 2023 |
|---|---|---|---|---|
| Scholarship Total | KRW 1,000 |
11,800 | 12,000 | 11,800 |
| Indicator | Unit | 2021 | 2022 | 2023 |
|---|---|---|---|---|
| No. of participating employees | Persons | 1,167 | 785 | 830 |
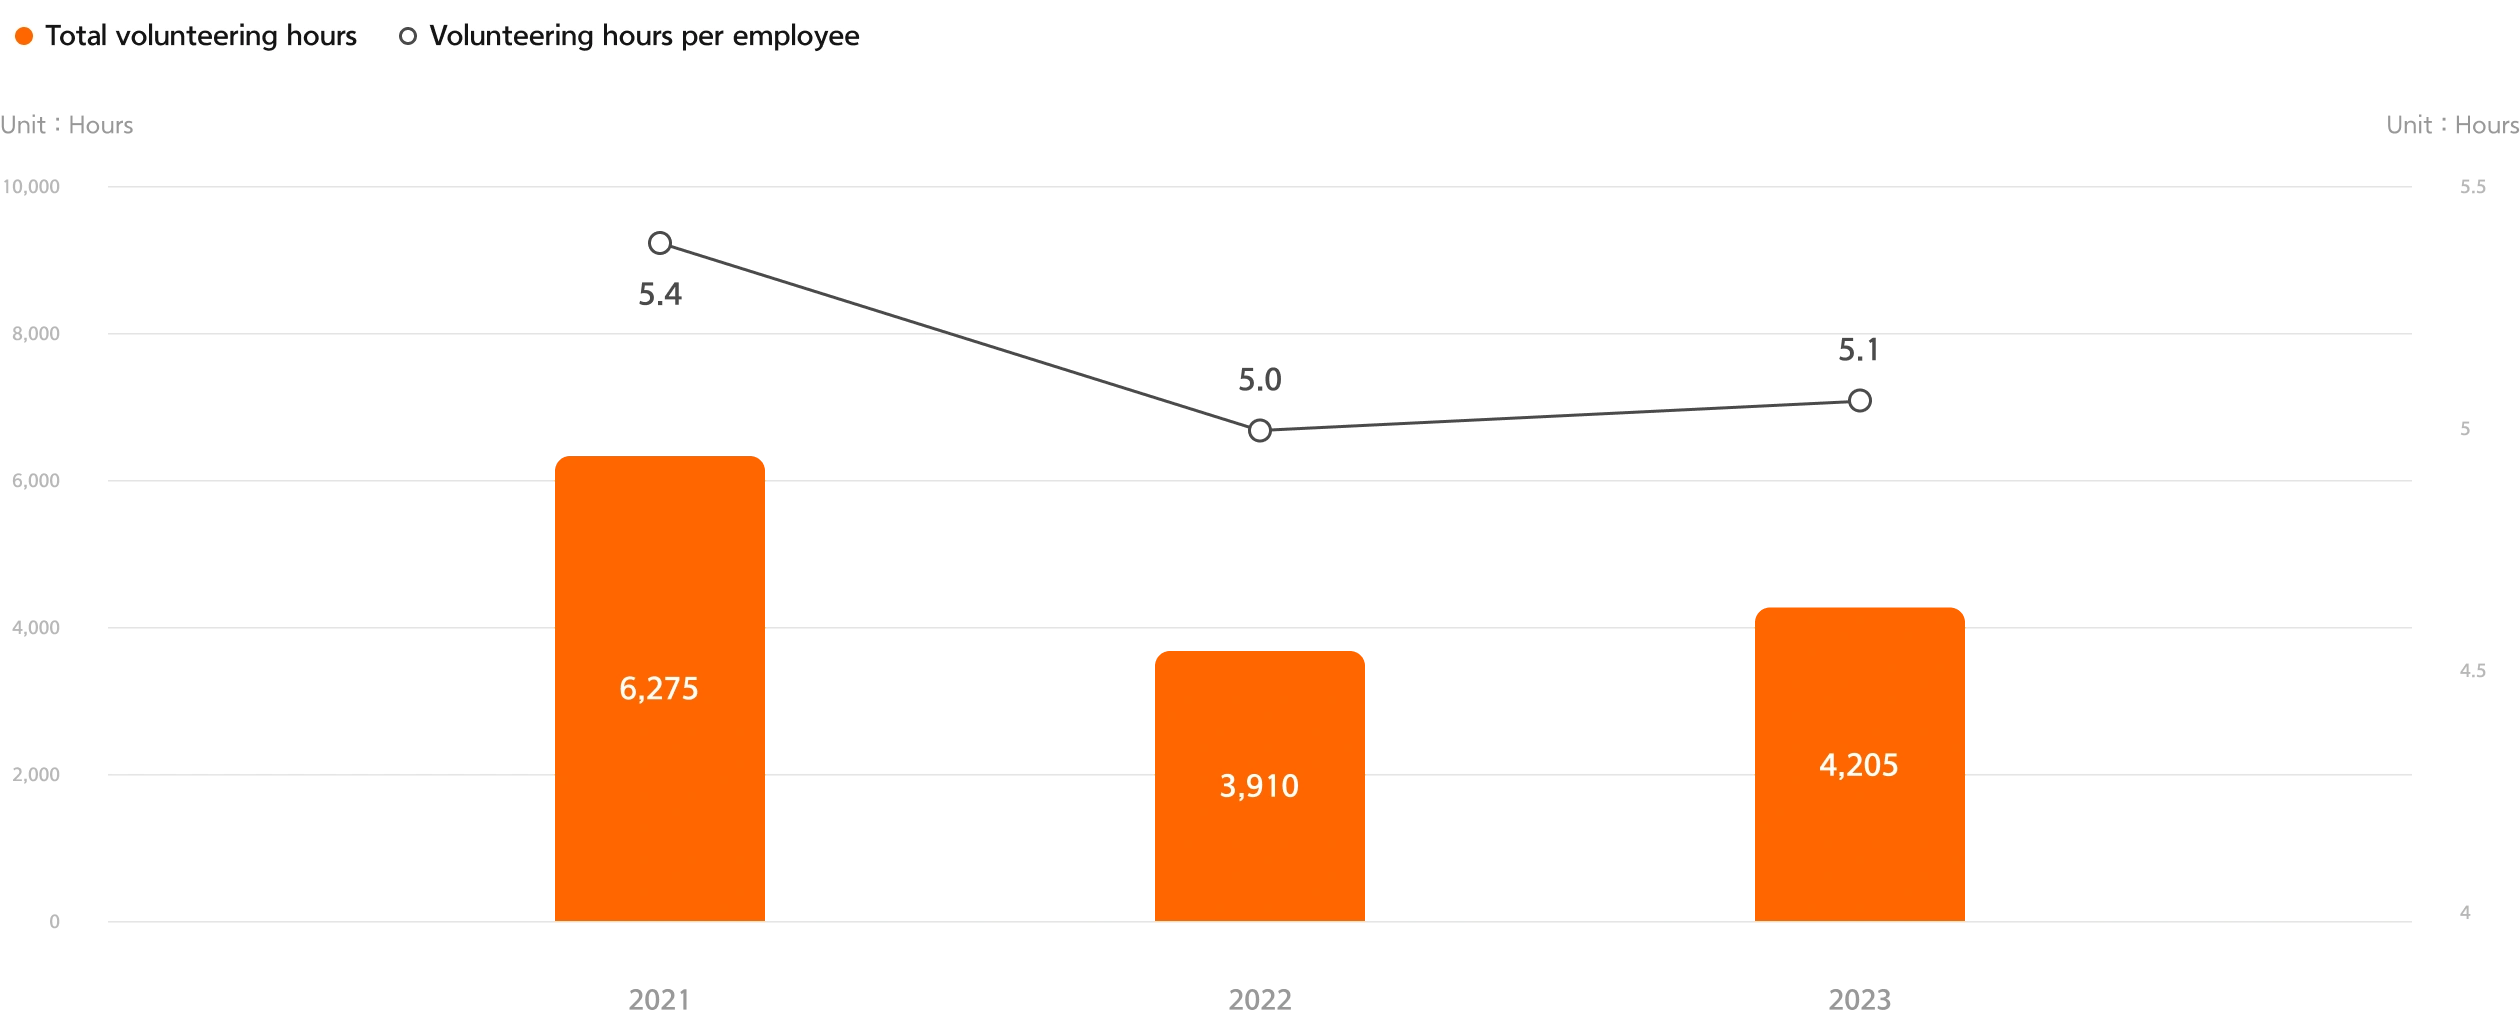
| Total volunteering hours | Hours | 6,275 | 3,910 | 4,205 |
| Volunteering hours per employee | Hours | 5.4 | 5 | 5.1 |