
Performance Data
Performance Data

Sound
Corporate Governance
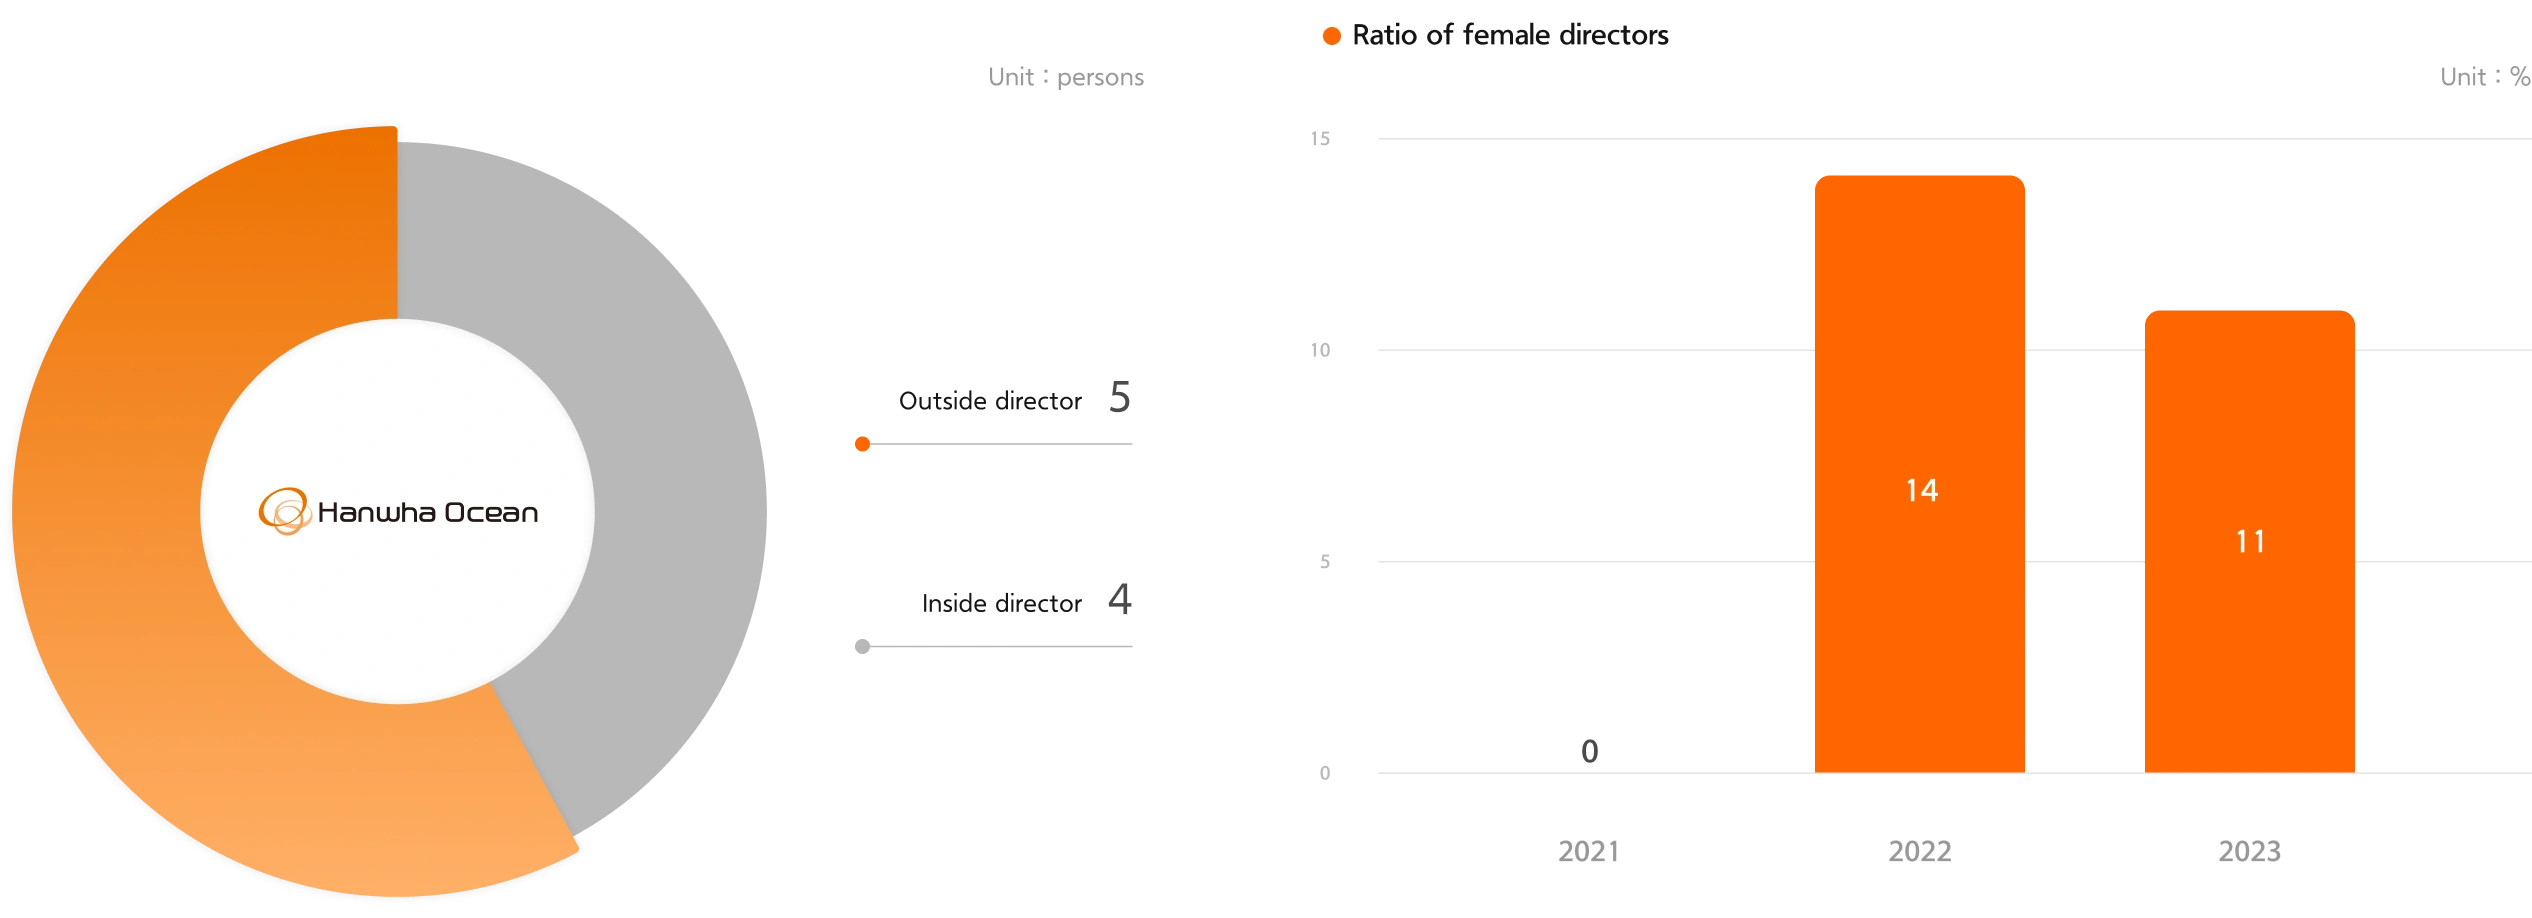
Board of Directors
| Indicator | Unit | 2021 | 2022 | 2023 | |
|---|---|---|---|---|---|
| Independence | Ratio of outside directors | % | 57 | 57 | 56 |
| No. of other external position allowed |
Positions | 2 | 2 | 2 | |
| Diversity | Ratio of female directors | % | - | 14 | 11 |
| No. of female directors who are neither the controlling shareholders nor relatives of registered directors | persons | - | 1 | 1 | |
| Expertise | No. of outside directors with industry experiences | % | 43 | 43 | 44 |
| Financial expert | persons | 1 | 1 | 1 | |
| Reduction or exclusion of liability | Subscription of liability insurance | Y/N | Y | Y | Y |
| Occurrence of leadership risk |
Cases | 0 | 0 | 0 | |
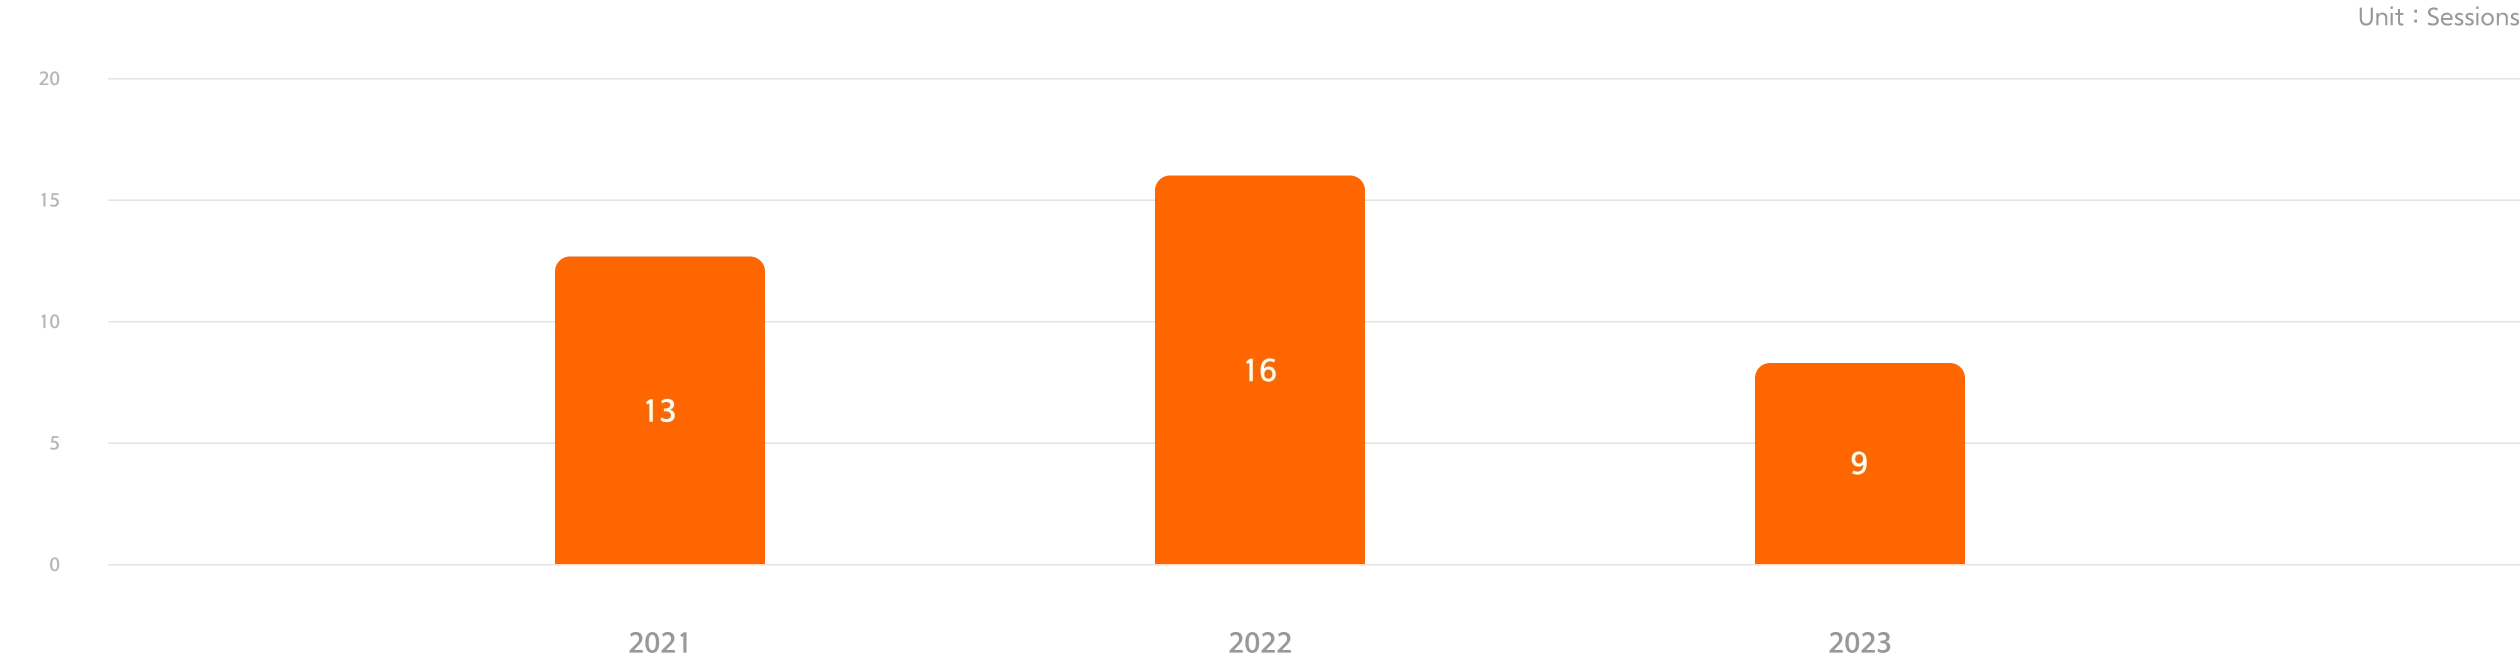
No. of meetings held
| Indicator | Unit | 2021 | 2022 | 2023 | |
|---|---|---|---|---|---|
| Meeting and attendance¹⁾ | No. of meetings held | Sessions | 13 | 16 | 9 |
| Attendance rate | % | 97.8 | 94.3 | 93.8 | |
| Attendance rate of outside directors |
% | 96.2 | 91.7 | 100.0 | |
| Opinions by agenda¹⁾ | Agenda for report | Items | 21 | 23 | 0 |
| Agenda for resolution | Items | 25 | 27 | 54 | |
- 1) Calculated after the launch of Hanwha Ocean in May 2023.
| Indicator | Unit | 2021 | 2022 | 2023 |
|---|---|---|---|---|
| No. of members | Persons | - | 5 | 3 |
| Ratio of outside directors | % | - | 80 | 66.67 |
| No. of ESG experts | Persons | - | 2 | - |
| Attendance rate | % | - | 100 | 100 |
| No. of meetings held | Sessions | - | 2 | 2 |
| No. of agenda items approved | Sessions | - | 1 | 2 |
| No. of agenda items reported | Sessions | - | 3 | - |
| No. of against or amendment | Sessions | - | - | - |
Ethics and Compliance
Ethics and Compliance Education
| Indicator | Unit | 2021 | 2022 | 2023 | |
|---|---|---|---|---|---|
| Ethics education | Training hours per employee | Hours | 0.42 | 0.52 | 0 |
| Participation rate | % | 42 | 52 | 0 | |
| No. of education sessions |
Sessions | 15 | 23 | 0 | |
| Compliance education | No. of participants | Persons | 3,884 | 3,853 | 801 |
Information Security
Investments in Information Security
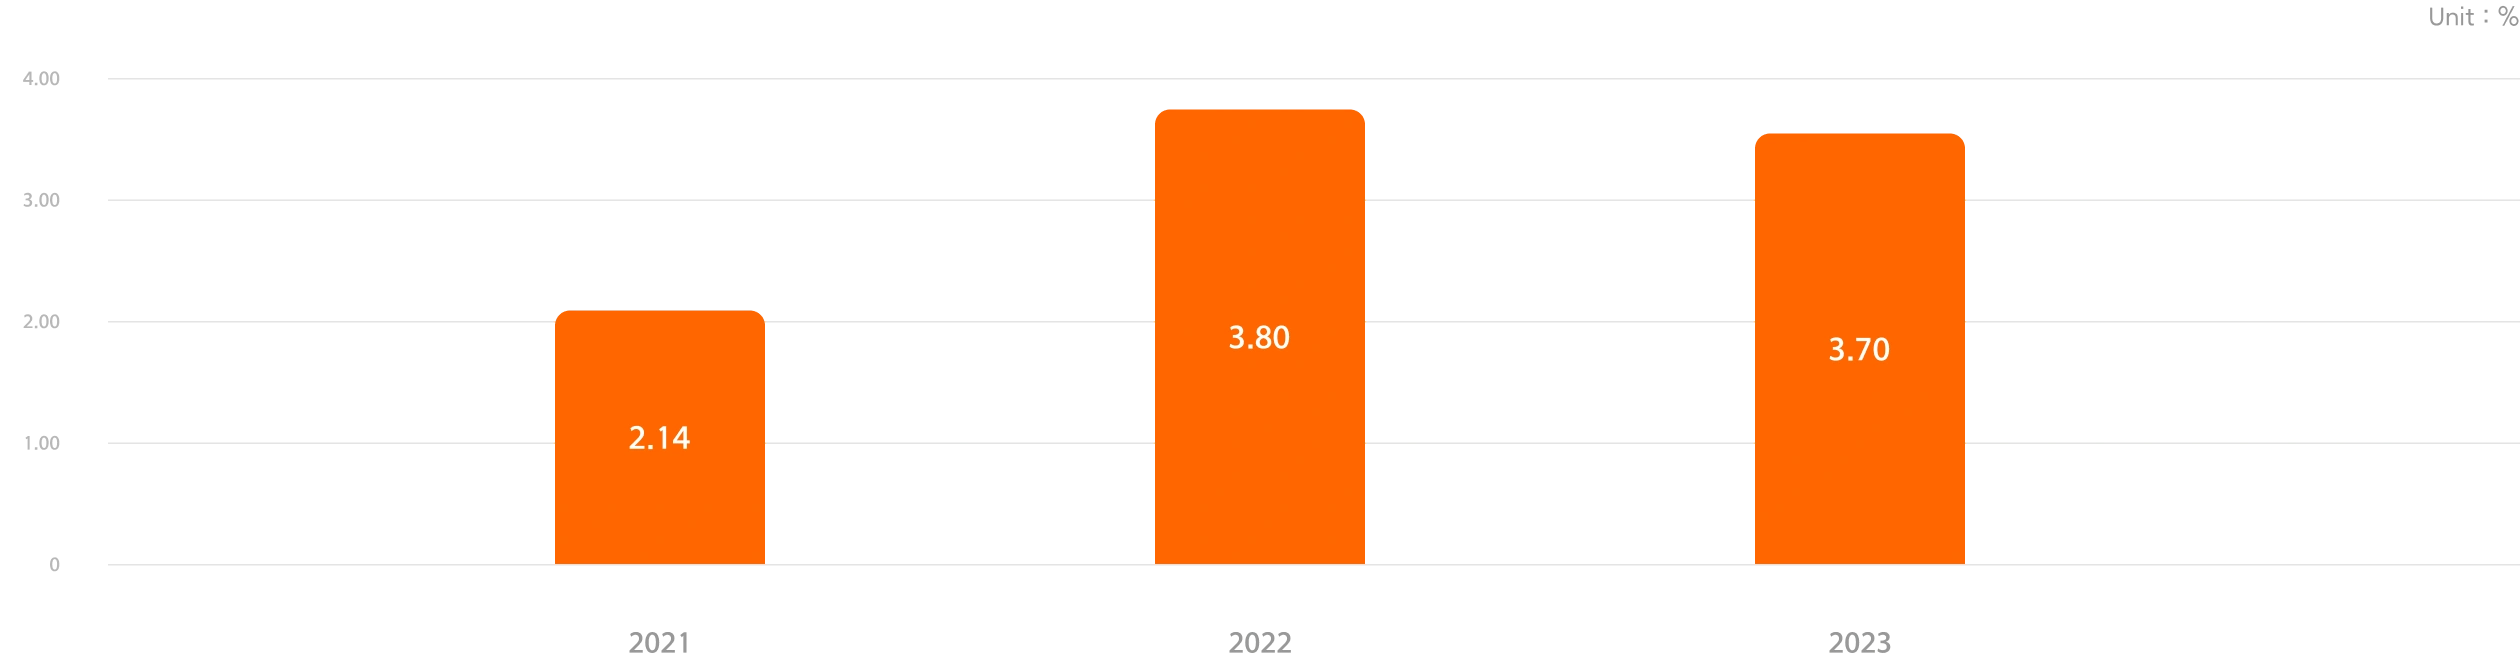
Percentage of Information Security Investments
| Indicator | Unit | 2021 | 2022 | 2023 |
|---|---|---|---|---|
| Percentage of ISO 27001 certification | % | 100 | 100 | 100 |
| Percentage of information security investments | % | 2.14 | 3.80 | 3.70 |
Information Security Training
| Indicator | Unit | 2021 | 2022 | 2023 | |
|---|---|---|---|---|---|
| General employees | Participants | Persons | 8,903 | 8,779 | 8,732 |
| Training hours | Hours | 18,166 | 22,393 | 21,982 | |
| Training hours per employee | Hours | 2.04 | 2.55 | 2.52 | |
| Participation rate | % | 100 | 100 | 100 | |
Data Breach
| Indicator | Unit | 2021 | 2022 | 2023 |
|---|---|---|---|---|
| Total no. of data protection violations | Cases | 0 | 0 | 0 |
| No. of customer data protection violations | Cases | 0 | 0 | 0 |
| Total amount of data breach fines and penalties |
KRW 1,000 | 0 | 0 | 0 |
Quality Management
Quality Indicators
| Classification | Indicator (%) | 2021 | 2022 | 2023 | |||
|---|---|---|---|---|---|---|---|
| Goal | Performance | Goal | Performance | Goal | Performance | ||
| Process inspection |
Retest rate | 1.12 | 0.75 | 1.03 | 0.59 | 0.64 | 0.89 |
| Hit rate | 97.37 | 98.22 | 97.70 | 98.05 | 98.03 | 97.55 | |
| NDT | Retest rate (radiographic test) |
1.58 | 1.71 | 1.58 | 2.25 | 0.99 | 0.99 |
| Retest rate (ultrasonic test) |
0.54 | 0.17 | 0.44 | 0.22 | 0.32 | 0.35 | |
- *Indicators related to the shipping business (separate indicators for naval and specialty ships)
Customer Satisfaction
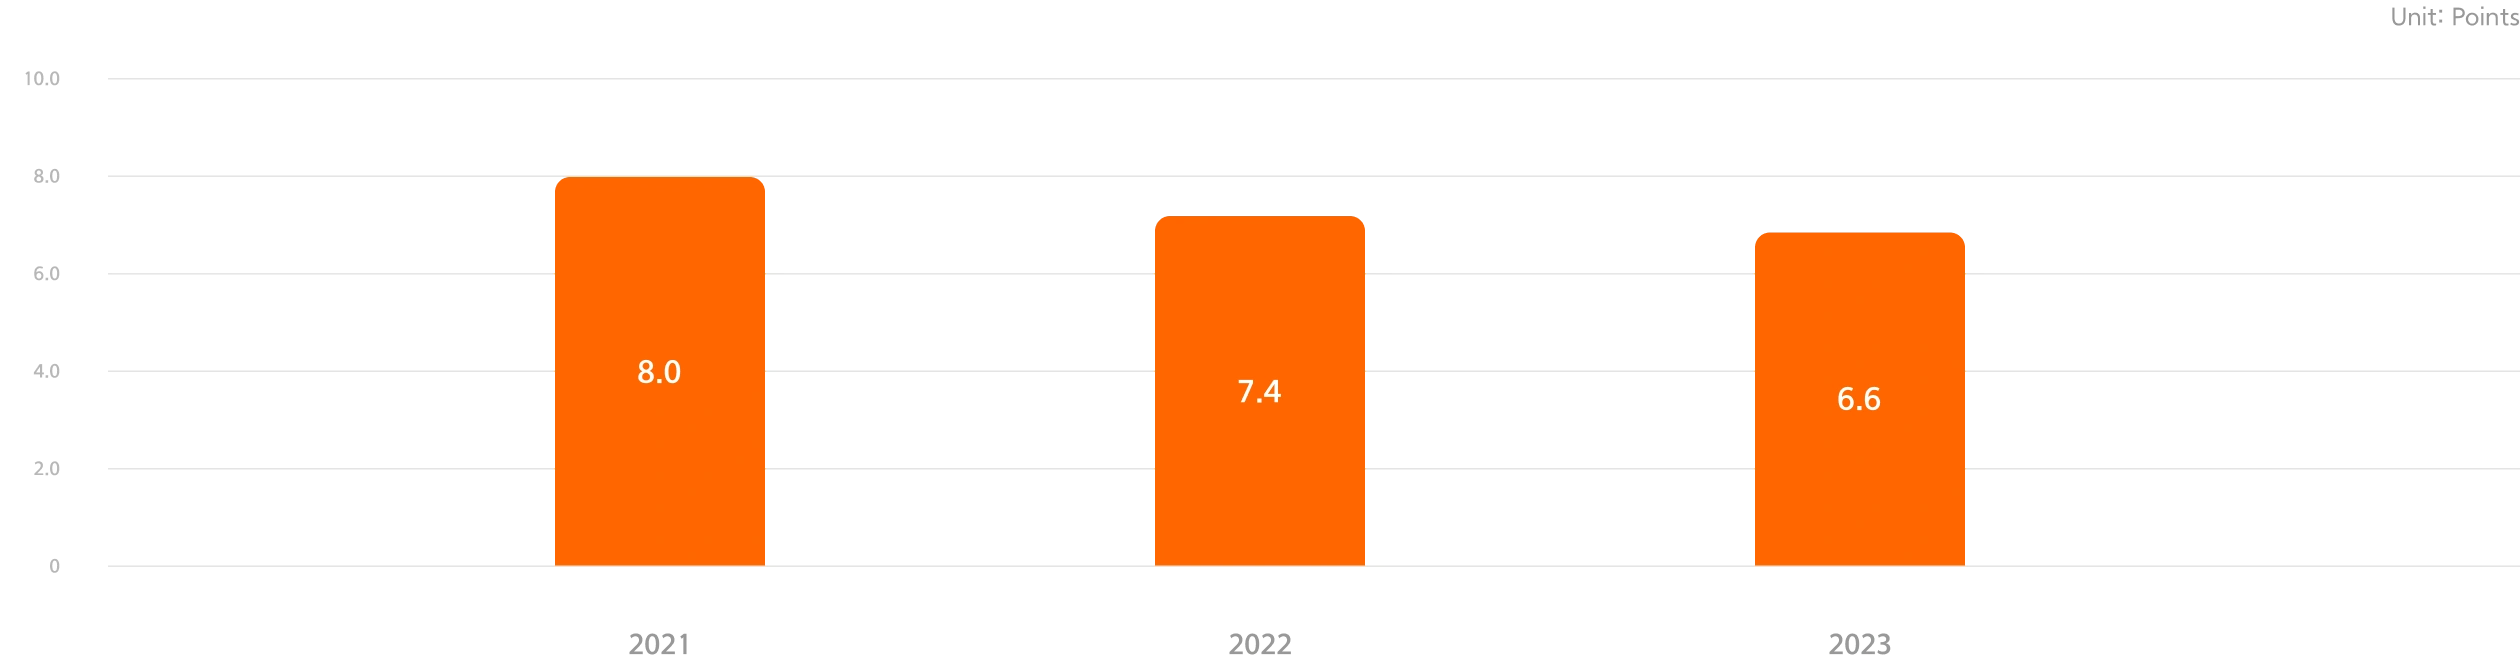
Customer Satisfaction Score
| Indicator | Unit | 2021 | 2022 | 2023 |
|---|---|---|---|---|
| Customer satisfaction score | Points | 8.0 | 7.4 | 6.6 |
| No. of customers responded | Companies | 12 | 13 | 17 |