Performance Data
Performance Data
Climate Action
Greenhouse Gas Management
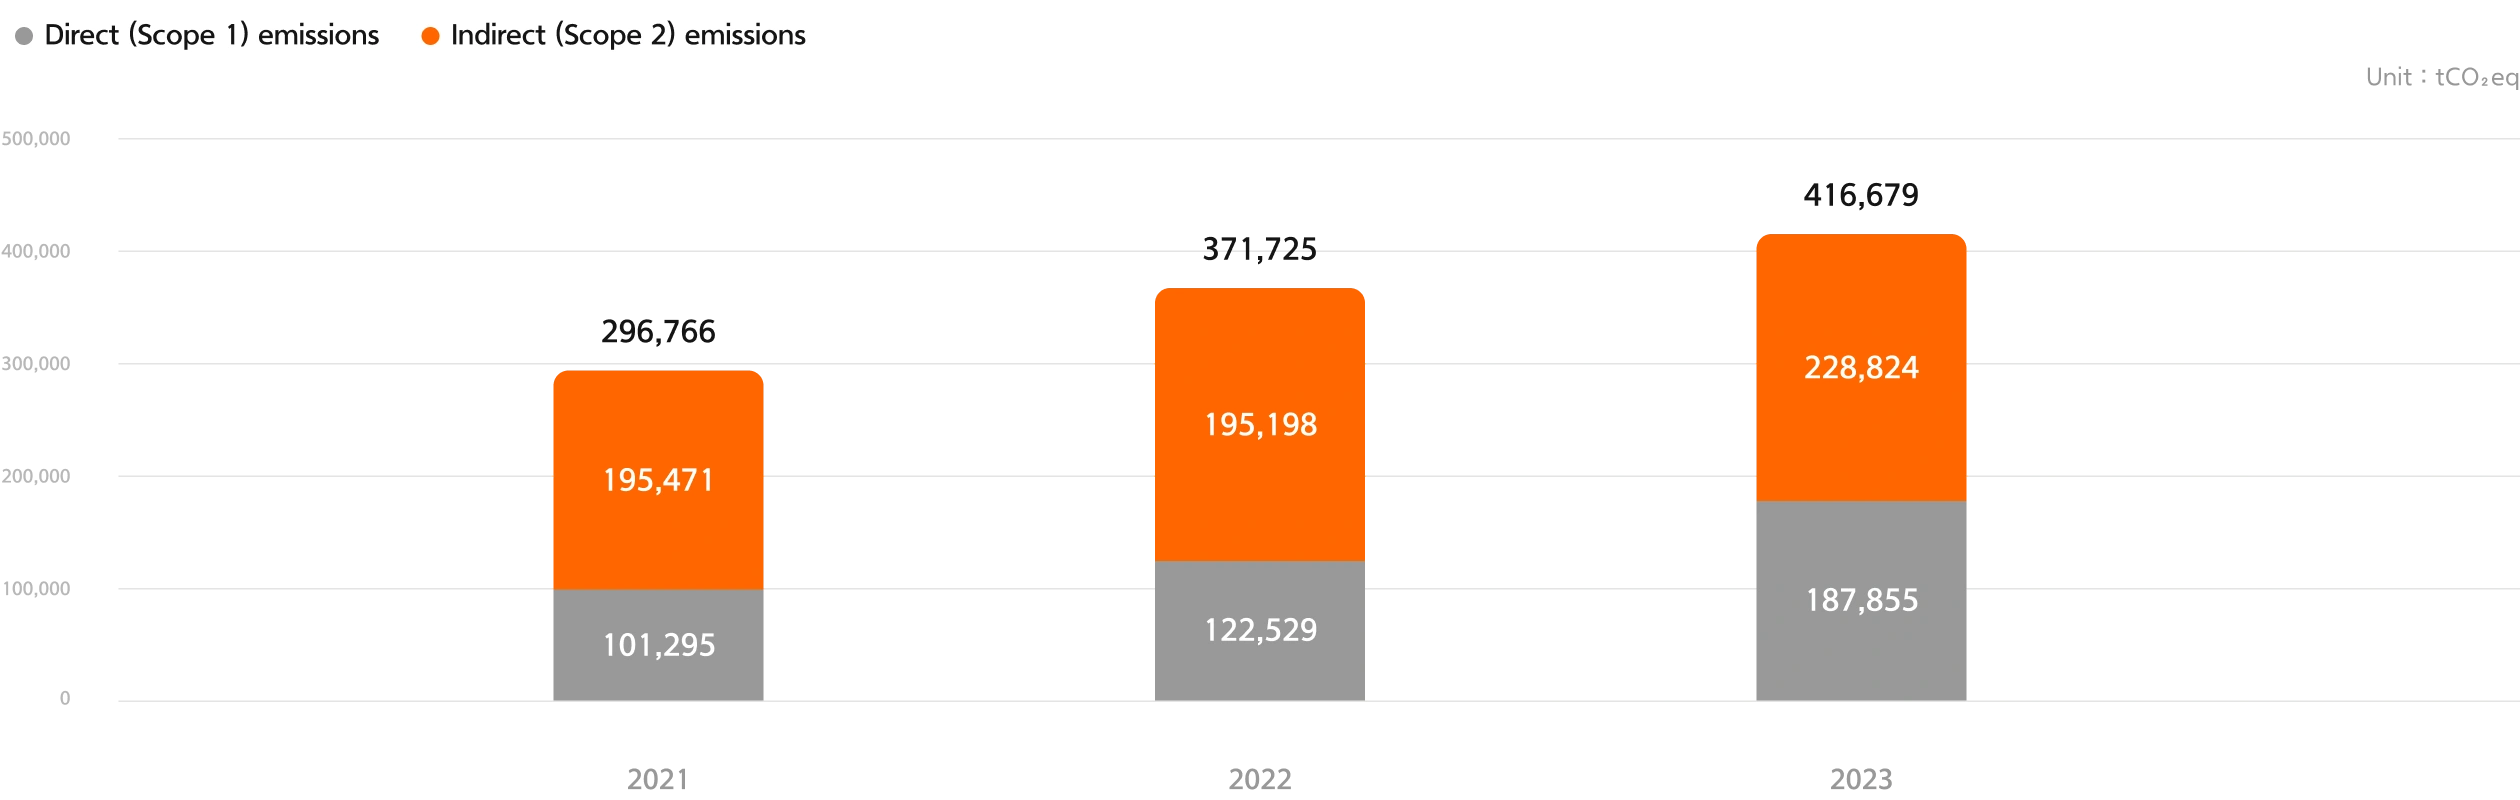
Total Emissions (Scope 1 & 2)
| Indicator | Unit | 2021 | 2022 | 2023 |
|---|---|---|---|---|
| Total emissions (Scope 1 & 2) | tCO2eq | 296,766 | 317,725 | 416,679 |
| Direct (Scope 1) emissions | tCO2eq | 101,295 | 122,529 | 187,855 |
| Indirect (Scope 2) emissions | tCO2eq | 195,471 | 195,198 | 228,824 |
| GHG emissions intensity | tCO2eq/ KRW 100 million |
6.61 | 6.54 | 5.61 |
| Reduction rate (intensity) | % | -29.03 | 1.17 | 14.22 |
| Indicator | Unit | 2021 | 2022 | 2023 |
|---|---|---|---|---|
| Total (Scope 3) emissions | tCO2eq | 134,519 | 20,606,295 | 29,030,930 |
| Purchased goods and services | tCO2eq | - | 3,176,178 | 2,952,151 |
| Capital goods | tCO2eq | 873 | 4,201 | 6,413 |
| Fuel- and energy-related activities | tCO2eq | 13,004 | 28,351 | 27,215 |
| Upstream transportation and distribution | tCO2eq | 34,828 | 41,846 | 39,697 |
| Waste generated in operations | tCO2eq | 52,777 | 54,898 | 57,601 |
| Business trips | tCO2eq | 3,056 | 2,180 | 3,616 |
| Employee commuting | tCO2eq | 2,461 | 3,930 | 3,886 |
| Use of sold products | tCO2eq | - | 17,234,930 | 25,870,819 |
| End of life treatment of sold products | tCO2eq | - | 2,454 | 4,072 |
| Investments | tCO2eq | 28,393 | 57,327 | 65,460 |
Energy Management
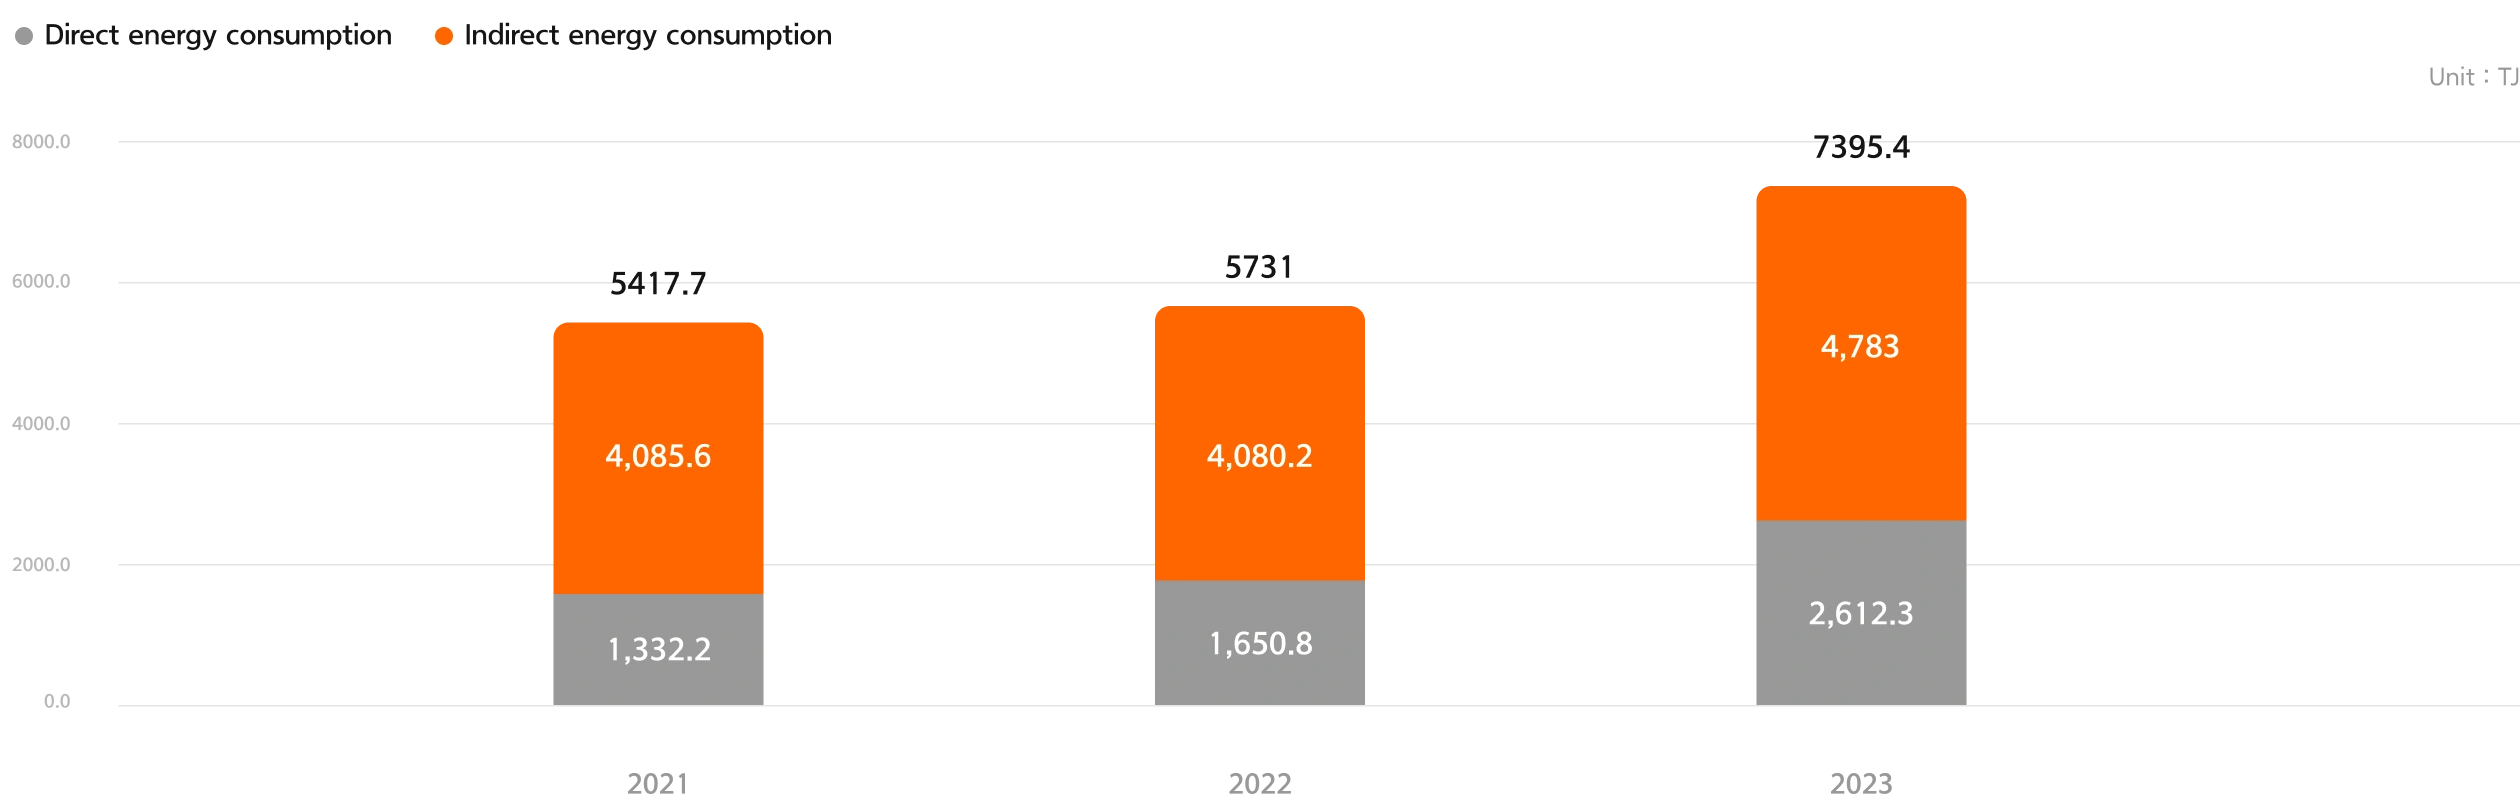
Total Energy Consumption
| Indicator | Unit | 2021 | 2022 | 2023 |
|---|---|---|---|---|
| Total energy consumption | TJ | 5417.7 | 5731 | 7395.4 |
| Direct energy consumption |
TJ | 1332.2 | 1650.8 | 2612.3 |
| Indirect energy consumption |
TJ | 4085.6 | 4080.2 | 4783.0 |
| Energy intensity(KRW) | TJ/ KRW 100 million |
0.121 | 0.118 | 0.1 |
| Reduction rate (KRW ) | % | -31.901 | 2.334 | 15.603 |
Environmental Management
Water Management
| Indicator | Unit | 2021 | 2022 | 2023 | |
|---|---|---|---|---|---|
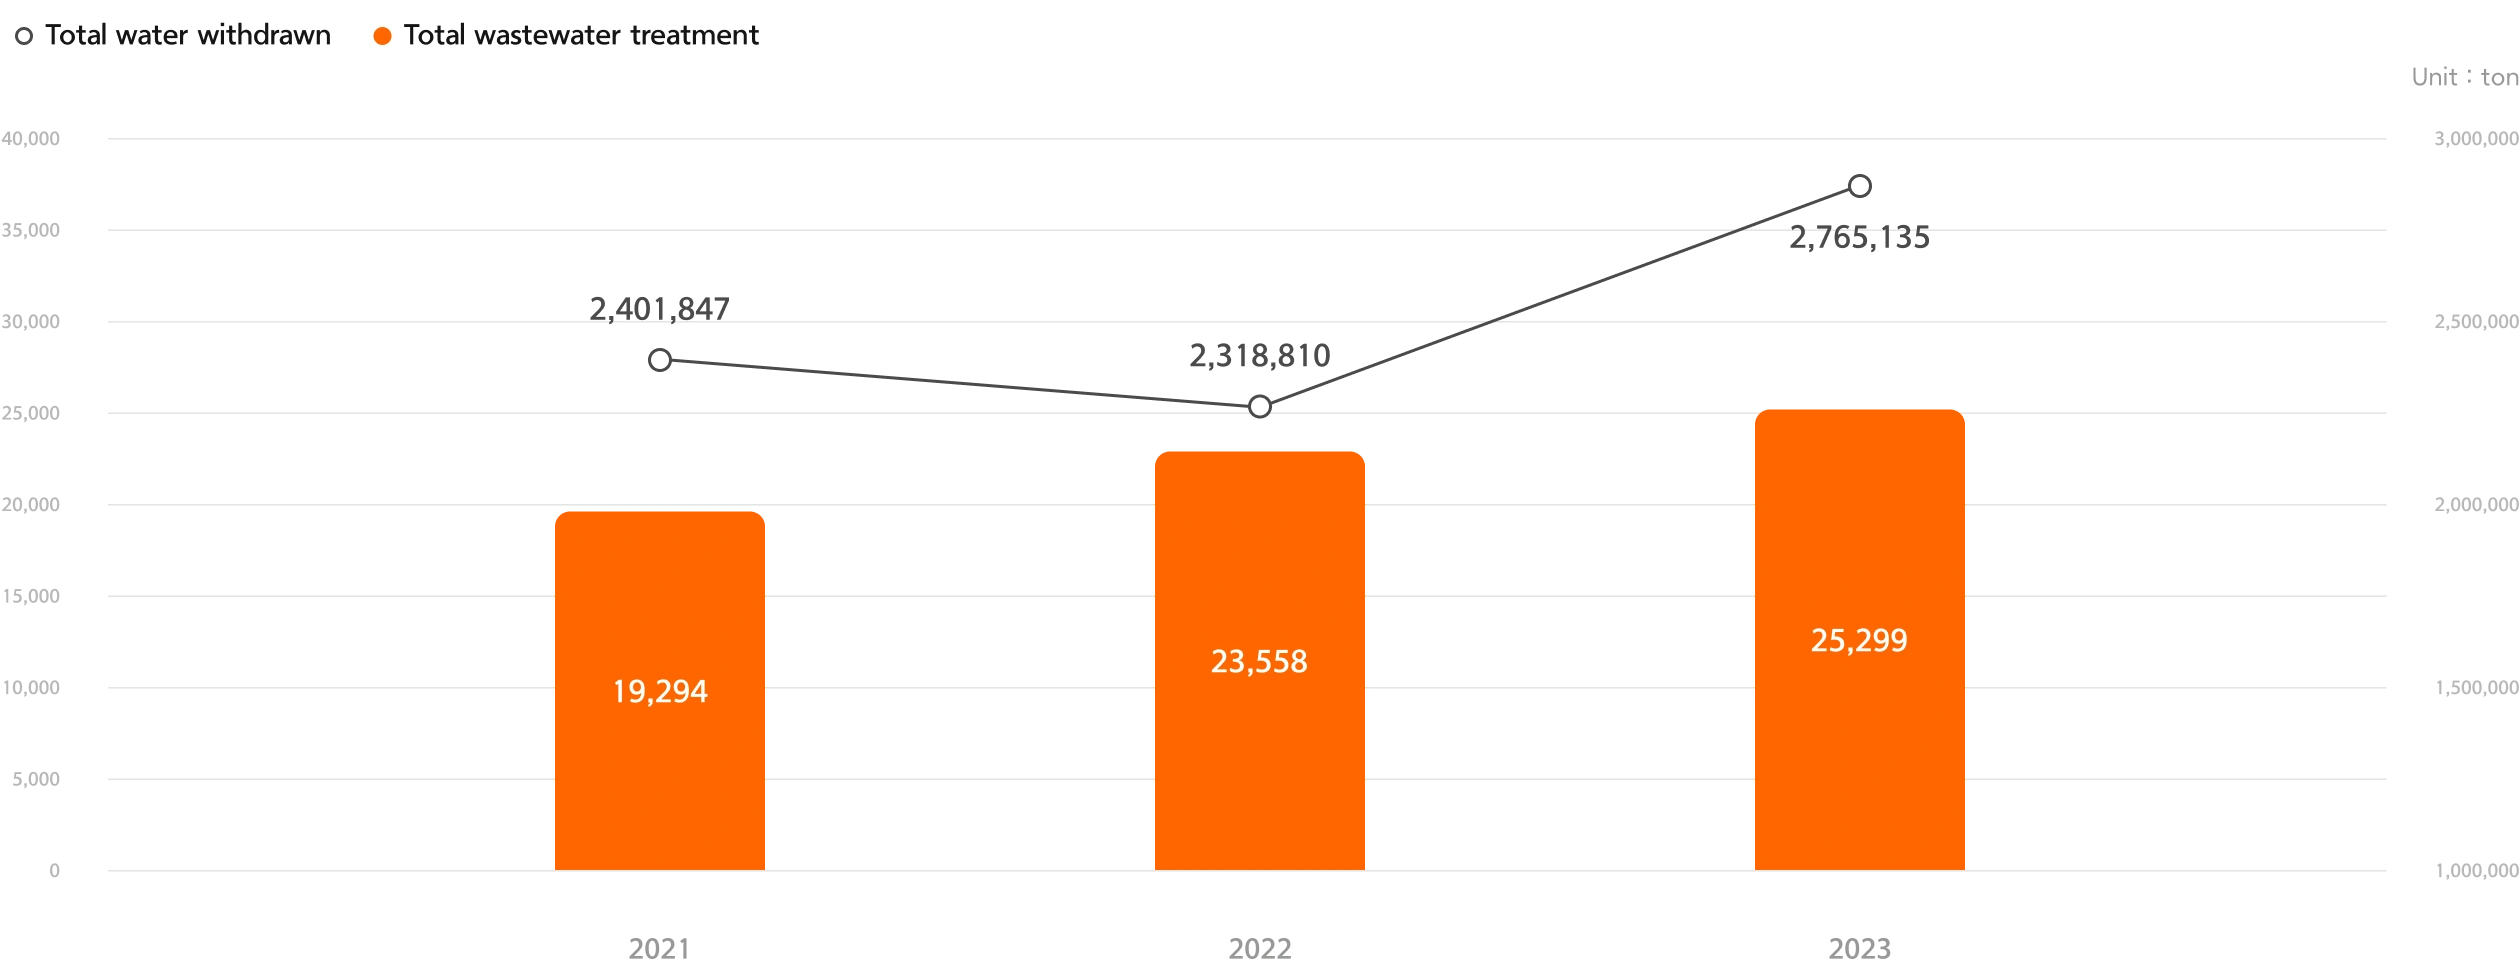
| Water | Total water withdrawn¹⁾ | ton | 2,401,847 | 2,318,810 | 2,765,135 |
| Service water (for shipyards) |
ton | 2,297,929 | 2,216,945 | 2,682,168 | |
| Groundwater | ton | 52,013 | 66,555 | 69,353 | |
| Service water (others) |
ton | 51,905 | 35,310 | 13,614 | |
| Water stress | Withdrawals | ton | 15,692 | 16,474 | 18,197 |
| Water withdrawal rate | % | 0.7 | 0.7 | 0.7 | |
| Wastewater treatment | Total wastewater treatment | ton | 19,294 | 23,558 | 25,299 |
| Sewage | Total sewage flow | ton | 771,445 | 843,352 | 1,006,056 |
| Recycled sewage | ton | 162,025 | 89,087 | 176,128 | |
| Recycled sewage rate | % | 21 | 10.6 | 17.5 | |
- 1) Total water withdrawals : Water withdrawals from Dumo Dormitory, NongsoResearch Institute, NeungpoDormitory, SeomunSports Center, and AnjeongIndustrial Complex were added alongside water withdrawals from the OkpoShipyard since 2021.
Waste Management
Total Waste Generated
| Indicator | Unit | 2021 | 2022 | 2023 | |
|---|---|---|---|---|---|
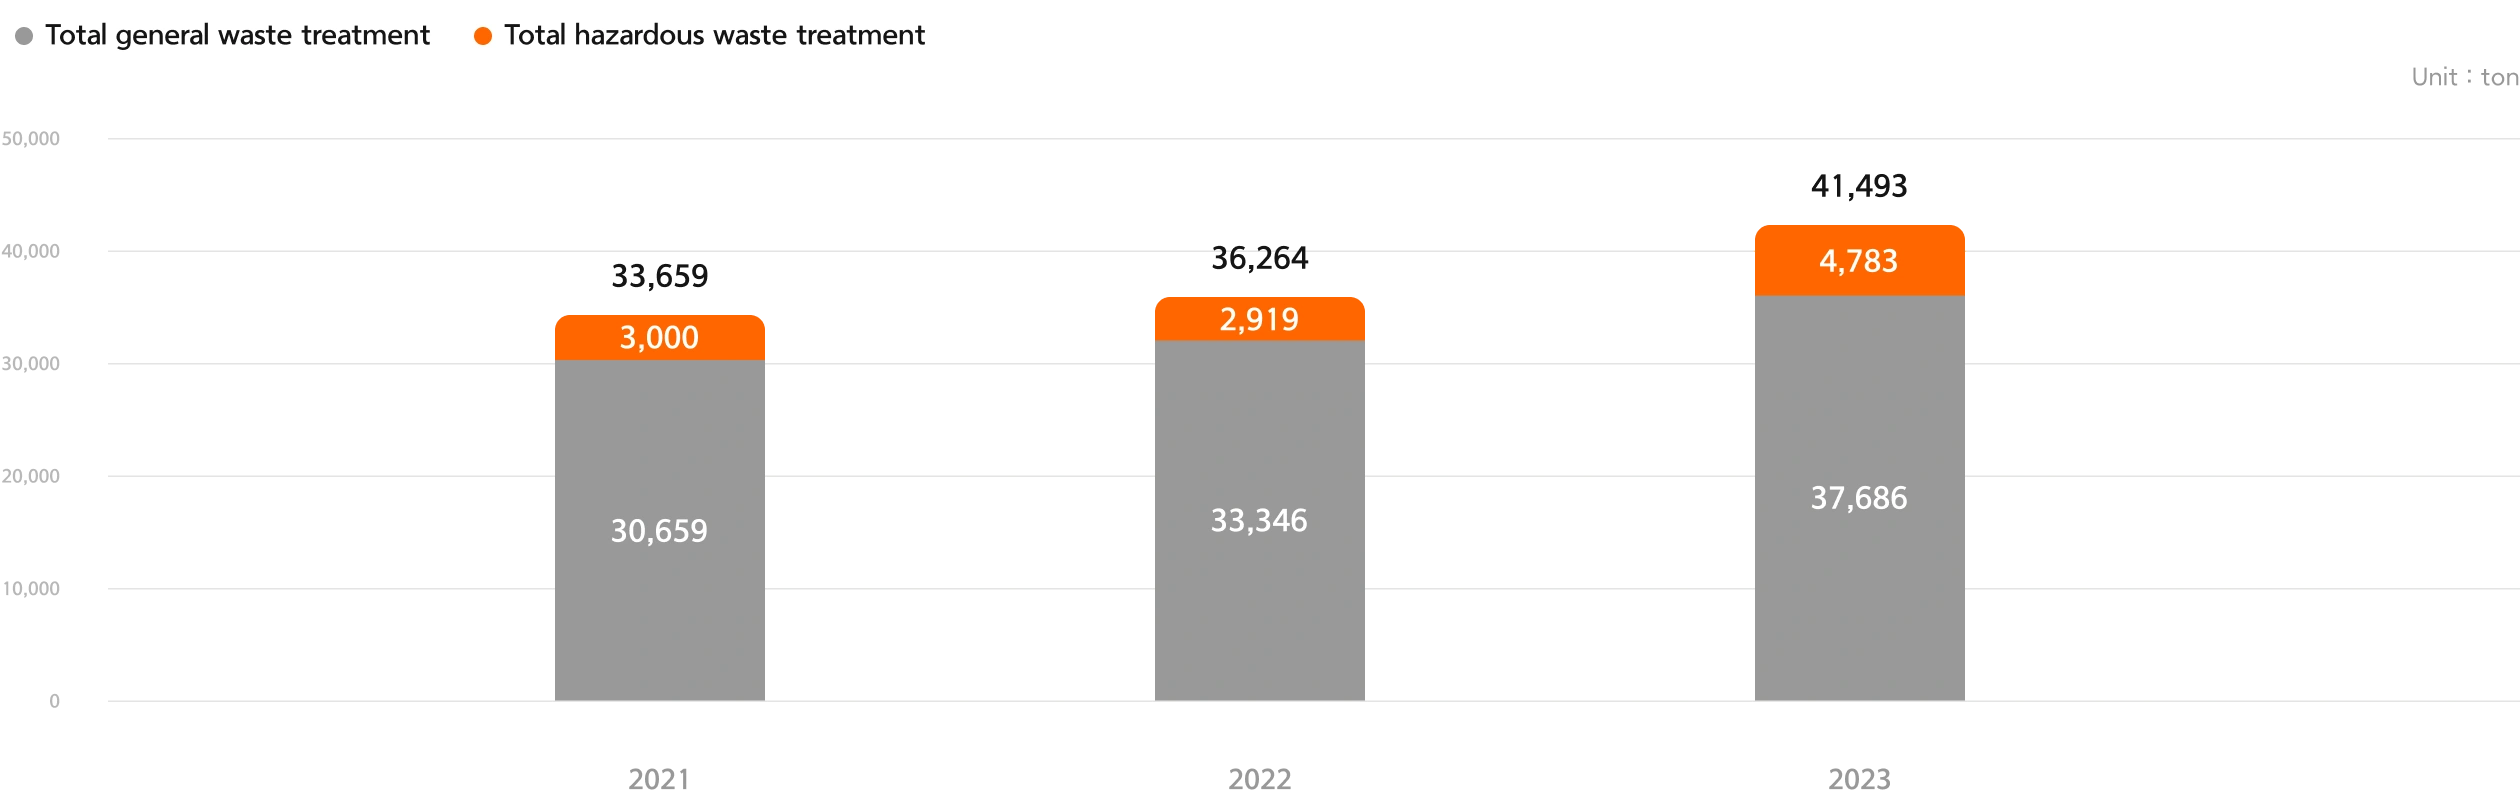
| Total waste generated¹⁾ | ton | 33,659 | 36,264 | 41,493 | |
| General waste treatment |
Total general waste treatment |
ton | 30,659 | 33,346 | 37,686 |
| Landfill | ton | 4,873 | 6,015 | 7,247 | |
| Incineration (heat recovery) |
ton | 6,998 | 6,920 | 6,655 | |
| Recycled | ton | 17,841 | 19,515 | 23,021 | |
| Others & physico- chemical treatment |
ton | 946 | 895 | 763 | |
| Hazardous waste treatment | Total hazardous waste treatment (designated waste) | ton | 3,000 | 2,919 | 3,807 |
| Landfill | ton | 16 | 55 | 40 | |
| Incineration (heat recovery) | ton | 1,136 | 1,014 | 1,484 | |
| Recycled | ton | 1,846 | 1,844 | 2,274 | |
| Others | ton | 2 | 6 | 9 | |
- 1) Calculated based on Okpo, Siheung, Anjeong business sites.
Pollutant Management
Chemical Substance Management
| Indicator | Unit | 2021 | 2022 | 2023 |
|---|---|---|---|---|
| Amount of hazardous chemicals used | ton | 0 | 0.05 | 913.8 |
Air Pollution Management¹⁾
| Indicator | Unit | 2021 | 2022 | 2023 | |
|---|---|---|---|---|---|
| NOx | Nitrogen oxide (NOx) emissions | ton | 6.896 | 8.107 | 9.012 |
| NOx emissions intensity | tons/ KRW 100 million |
0.000154 | 0.000167 | 0.00012 | |
| SOx | Sulfur oxide (SOx) emissions | ton | 0.023 | 0.124 | 0.47 |
| SOx emissions intensity | tons/ KRW 100 million |
0.000001 | 0.000003 | 0.000006 | |
| VOCs | Volatile organic compound (VOC) emissions | ton | 1871 | 1,257 | 1,375 |
| VOC emissions intensity | tons/ KRW 100 million |
0.041702 | 0.025863 | 0.01856 | |
| PM | Particulate matter (PM10) emissions | ton | 13.54 | 13.50 | 13.36 |
| PM10 emissions intensity | tons/ KRW 100 million |
0.000302 | 0.000278 | 0.00018 | |
- 1) Calculated based on Okpo, Siheung, Anjeong business sites.
Water Pollution Management
| Indicator | Unit | 2021 | 2022 | 2023 | |
|---|---|---|---|---|---|
| TOC | Total organic carbon (TOC) emissions | ton | 0 | 0.145 | 0.259 |
| TOC emissions intensity | tons/ KRW 100 million |
0 | 0.000003 | 0.000003 | |
| COD | Chemical oxygen demand (COD) emissions | ton | 0.16 | Changed to TOC |
Changed to TOC |
| COD emissions intensity | tons/ KRW 100 million |
0.0000036 | Changed to TOC |
Changed to TOC |
|
| SS | Suspended solid (SS) emissions | ton | 0.035 | 0.031 | 0.019 |
| SS emissions intensity | tons/ KRW 100 million |
0.00000078 | 0.00000064 | 0.00000026 | |
Other Environmental Metrics
Environmental Investments

Environmental Investments and Sales
| Indicator | Unit | 2021 | 2022 | 2023 |
|---|---|---|---|---|
| Environmental investments | KRW 100 million | 93.6 | 215.9 | 39.4 |
| R&D cost | KRW 100 million | 96.1 | 50.7 | 48.3 |
| Low-carbon & carbon avoidance products¹⁾ | KRW 100 million | 21,774 | 25,660 | 43,442 |
- 1) The sales are calculated for ships with dual-fuel engines.
Environmental Law Violations
| Indicator | Unit | 2021 | 2022 | 2023 | |
|---|---|---|---|---|---|
| Violations of environmental laws and regulations |
Violations | Cases | - | - | - |
| Fines and penalties | KRW 1 million | - | - | - | |